
Push deterministic hardware intelligence directly into your existing analytics stack. Uncover hidden revenue leaks, align your teams, and maximize your Return On Ad Spend (ROAS).
Look at your current analytics dashboard. It groups an aging, thermal-throttled iPhone 8 and a brand-new iPhone 15 Pro into the exact same "Mobile iOS" bucket.
When your team sees a sudden 60% bounce rate on mobile, they are forced to guess. Is the new UI confusing? Is the network slow? Or did a heavy JavaScript bundle completely freeze the CPU of 30% of your visitors?
The Bottom Line: Standard analytics tools observe software. They are completely blind to physical computing power. You cannot optimize what you cannot measure.
ScaleDynamics translates raw silicon capabilities into two deterministic hardware metrics. By pushing these indices into your existing analytics tools as custom dimensions, you finally bring hardware reality into your business reporting:
Scores the general processing power, CPU constraints, and UI rendering limits of the device on a 4-tier scale.
Correlate UI latency with cart abandonment, bounce rates, and ROAS.
-p-500.png)
.png)
Scores the physical availability of WebGPU and VRAM required for Neural/AI processing on a 4-tier scale.
Track exactly what percentage of your AI workloads are safely executed locally ($0 cost) versus routed to your external Cloud APIs.
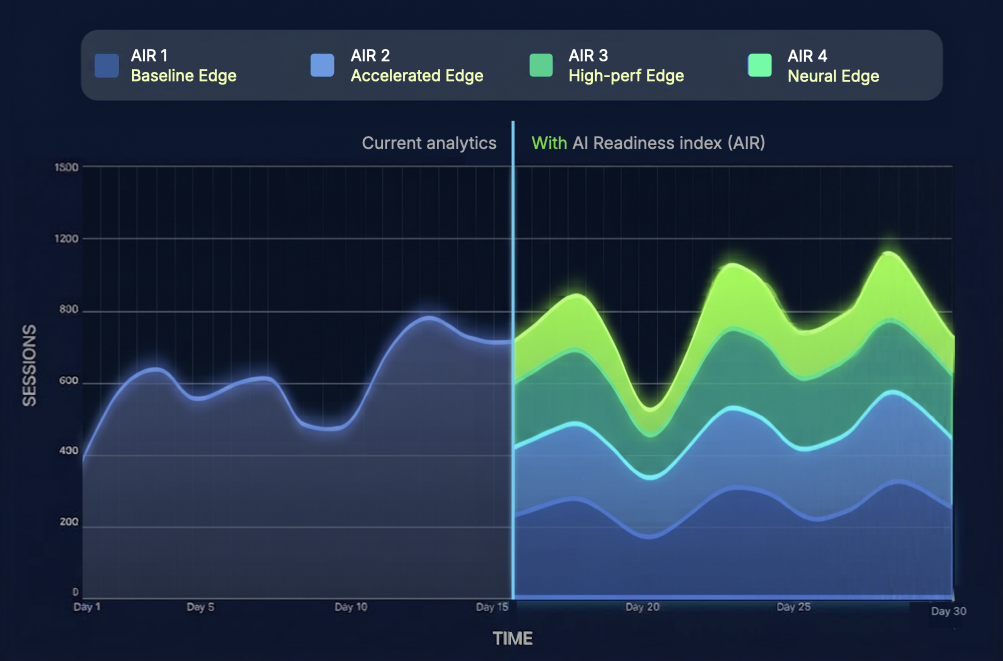
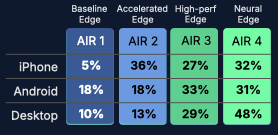
Scores the physical availability of WebGPU and VRAM required for Neural/AI processing on a 4-tier scale.
Track exactly what percentage of your AI workloads are safely executed locally ($0 cost) versus routed to your external Cloud APIs.
We know your teams already rely on tools like GA4, Mixpanel, Datadog, or Amplitude. We didn't build ScaleDynamics to replace them, we built it to give them the missing piece of the puzzle.
Because our sd-metrics.js script exposes the BDP tier directly to your frontend in milliseconds, your developers can push that exact score into your existing dataLayer with a single line of code.








Stop blaming the UX for hardware bottlenecks. By filtering your conversion funnels by BDP tier, the reality becomes obvious: BDP 1 users aren't abandoning their carts because they don't want to buy. They are leaving because the device cannot physically render your heavy visual assets fast enough. Use this data to justify building lightweight frontend fallbacks and recover millions in lost revenue.
Stop paying for traffic that cannot physically convert. Why pay a premium Cost-Per-Click (CPC) for a user whose smartphone will crash when loading your heavy promotional landing page? By linking BDP data to your marketing attribution, you can route lower-tier devices to ultra-lite, lightning-fast pages, drastically improving your Return on Ad Spend.
End the "War Room" debates. When a performance alert fires, the finger-pointing begins. With BDP integrated into your APM (like Datadog or Sentry), you can instantly isolate the root cause. Stop guessing if it's a server latency issue, and prove definitively that a heavy DOM manipulation is choking BDP 1 devices.
Our clients consistently find that users on high-end devices (BDP 4) convert up to 4.5x higher than users trapped on entry-level hardware (BDP 1). Connecting BDP to your analytics turns that invisible hardware penalty into an actionable business metric.
Stop optimizing in the dark. Choose how you want to bring hardware intelligence into your business metrics.
Get a definitive, data-backed map of your revenue leaks.
Let us deploy our passive script on your live traffic. We will deliver a board-ready executive report proving exactly how BDP and AIR constraints are impacting your conversions and cloud costs, before you touch your analytics stack.
Start pushing hardware data to your dashboards today.
Skip the diagnostic phase. Get the script and work with our engineers to expose the BDP and AIR variables directly into your frontend dataLayer.